Gantt Chart vs Kanban Board
To put it simply, Gantt charts are useful when dependencies are the main driver for the schedule, whereas Kanban boards can be used for items that don’t have dependencies with each other.
Besides that, Gantt charts are suitable when there’s an upfront plan for the whole scope of the project (at least at high level), while Kanban boards are more suited to cases where the entire plan emerges and evolves throughout the project.
Kanban boards are better for repetitive work (work with similar steps) while Gantt charts are better for a combination of different types of work.
Finally, these two provide different perspectives on work, which should match your way of working and your development approach (Agile or predictive).
Now, let’s spend a few more minutes going into the details!
They are more than just different ways of visualizing data
Gantt charts and Kanban boards look very different, don’t they?
Both the Gantt chart and the Kanban board come with their own default way of visualizing data. While their way of visualizing may be important and may have practical consequences, the more important aspect is the concepts and techniques behind them; so let’s have a quick review of these.
The concepts behind Kanban boards
First, it’s important to note that a “Kanban board” is different from “Kanban”, which is a technique, and different again from “Kanban Development”, which is an alternative to Scrum (and highly inspired by Scrum).
The Kanban technique is something people have been using in manufacturing for some time. It has a few rules, and one of them is to visualize work. Its visualization is done on a Kanban board.
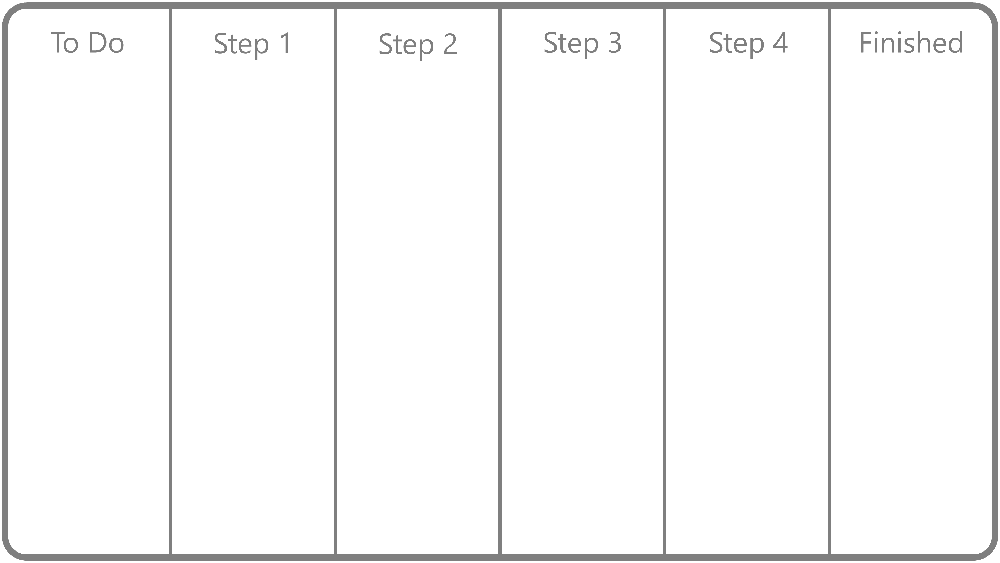
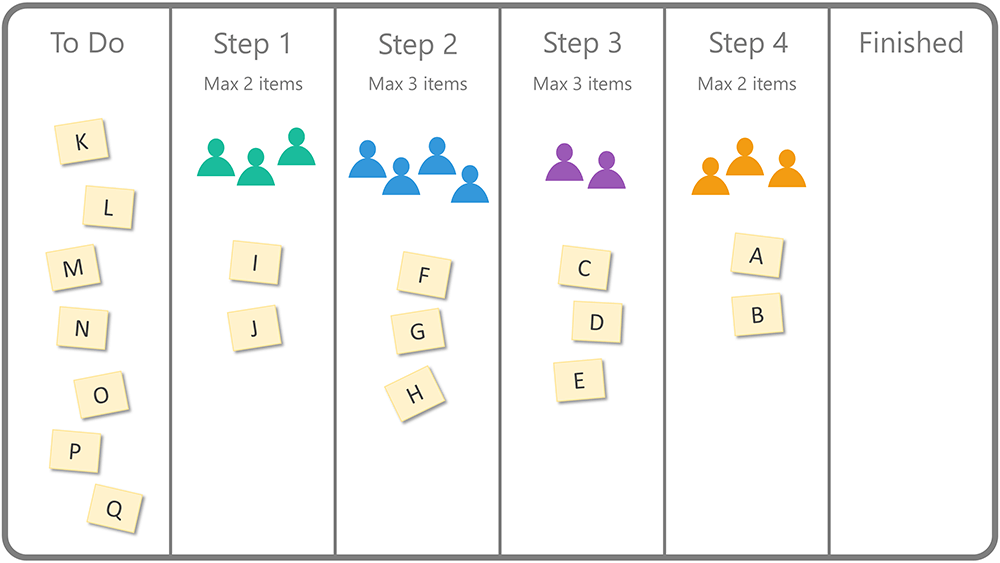
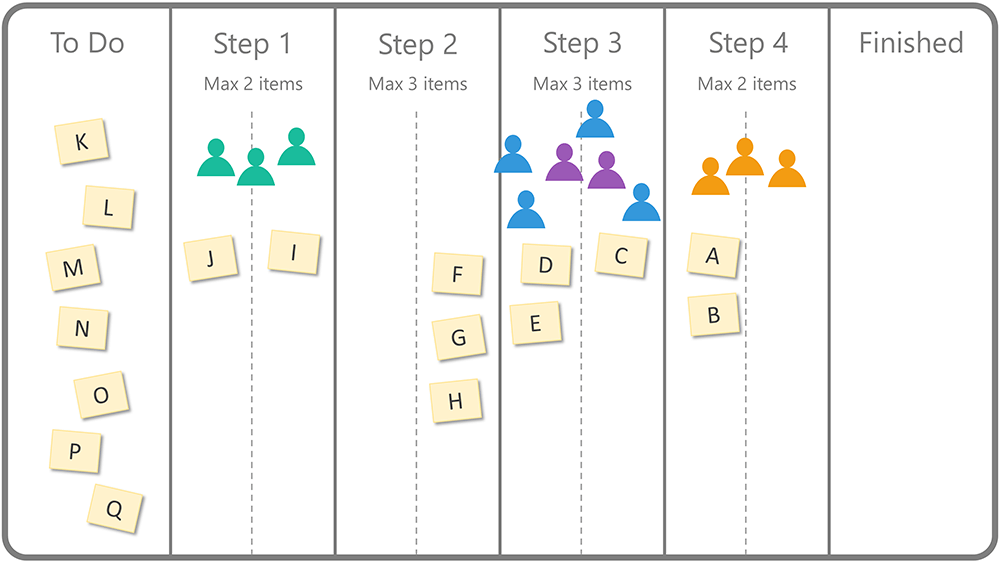
What we do in the Kanban technique is to identify the steps in the work and create columns for them on a board:
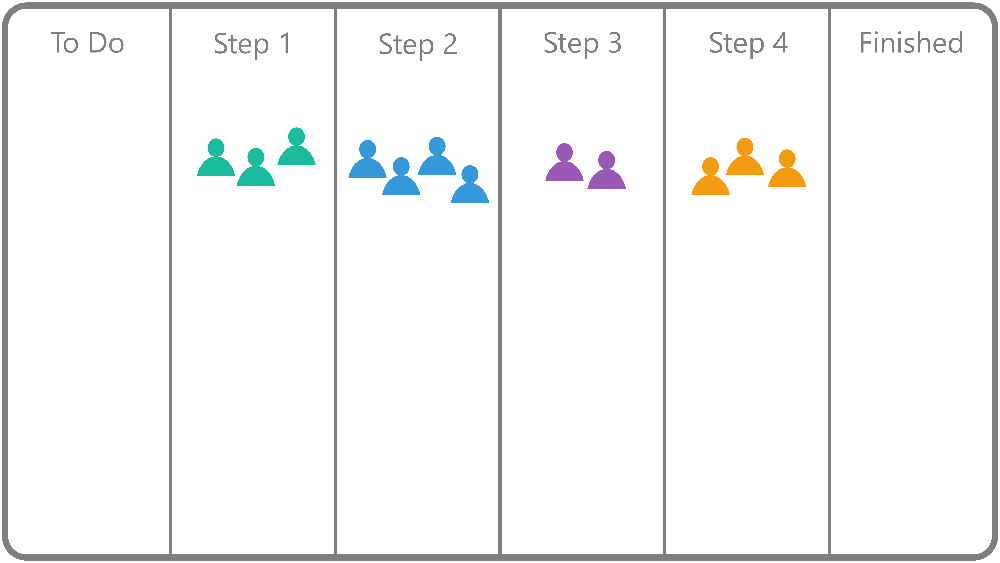
Several people work on each of those steps; so, let’s add them as well:
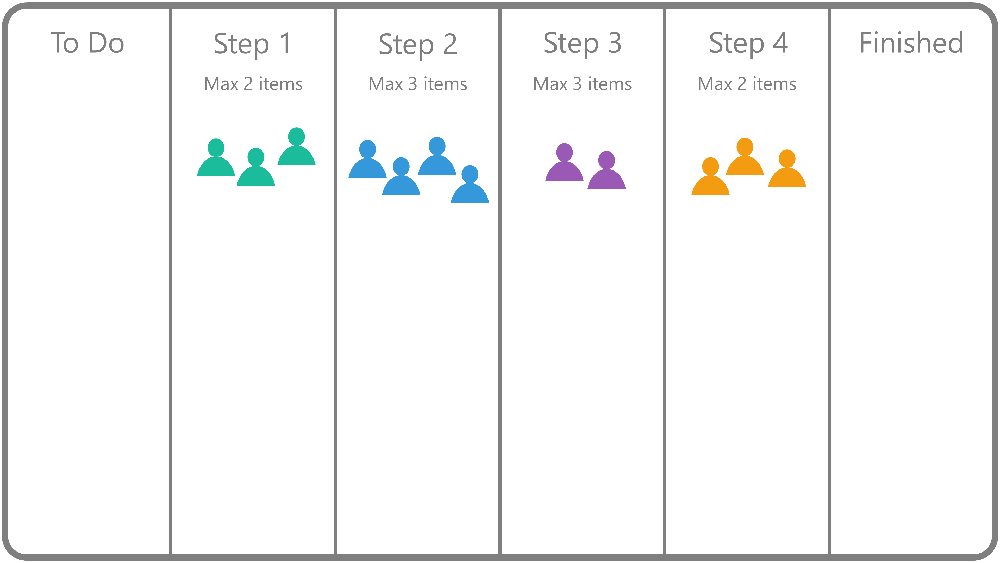
Another fundamental rule in Kanban (other than visualizing) is that each step of work must have a limit on work-in-progress, to focus on finishing items as soon as possible.
There’s no formula for calculating the best work-in-progress limit for each step. People usually use their experience to set an initial value based on the setup, and then use trial and error to reach the best output.
So, let’s add the work-in-progress limits to the board:
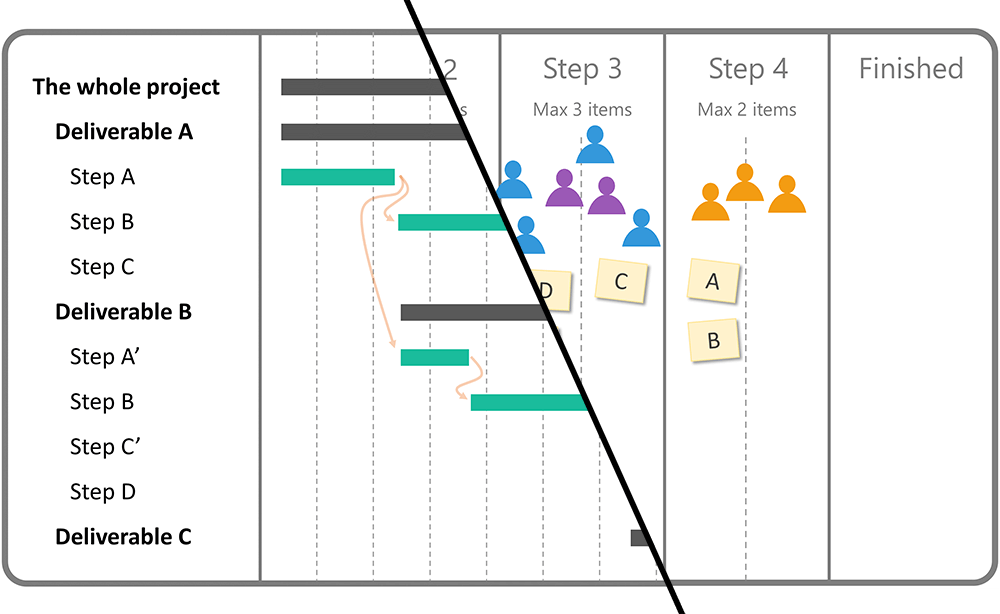
And then let’s imagine that they are already working on a few items:
Now let’s take the second step of the work in this chart: What should they do when they finish (F) in this step?
What we do in most setups is send the item to the next step: i.e., we “push” it to the next step. Kanban is different though: It’s a “pull” system, meaning that we can’t send the work to the next step; it stays there, until the next step needs another item and “pulls” it into its column. Sounds strange? Are you thinking about the practical differences between the two? I’ll tell you in a minute, but first let’s update our board to visualize it better, by splitting each column into two sections: one for the items in that column that still need work, and one for those that are finished:
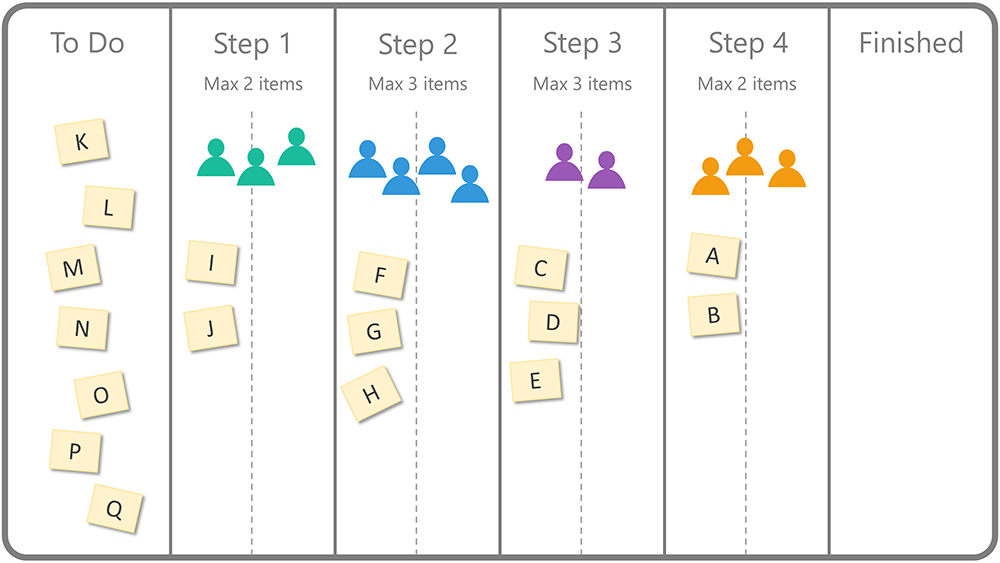
Now, instead of sending (F) to the next column, we will put it on the right-hand side of our own column.
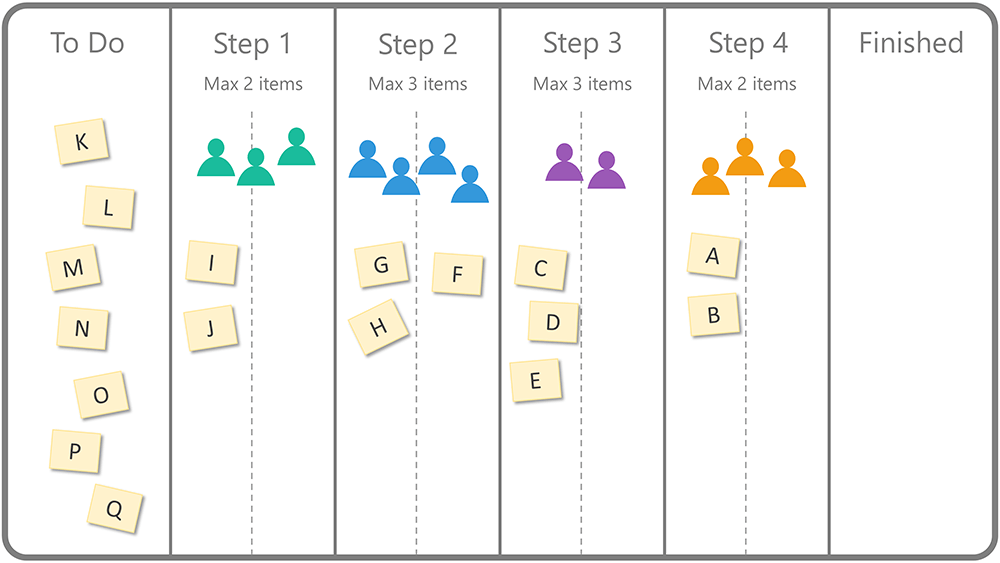
So, you asked about the practical difference, and here it is: Imagine that (G), (H), (I), and (C) are finished:
What do you do if you’re on Step 2?
The normal answer is that you will bring (I) from the previous column and start working on it. But wait – your work-in-progress limit is three, and you already have three items! Yes – (F), (G), and (H), which are on the right-hand side of your column, still count. It’s also a pull system, and you have to wait for the people on Step 3 to pull (F), instead of you pushing it into their column.
The problem is, you’re not allowed to bring in a new item, but you don’t have anything else to do; so what happens now?
This constraint is crucial in Kanban. At this moment, the people on Step 2 cannot start working on a new item, and have to go and help people who are dealing with the bottleneck, which is Step 3 in our example:
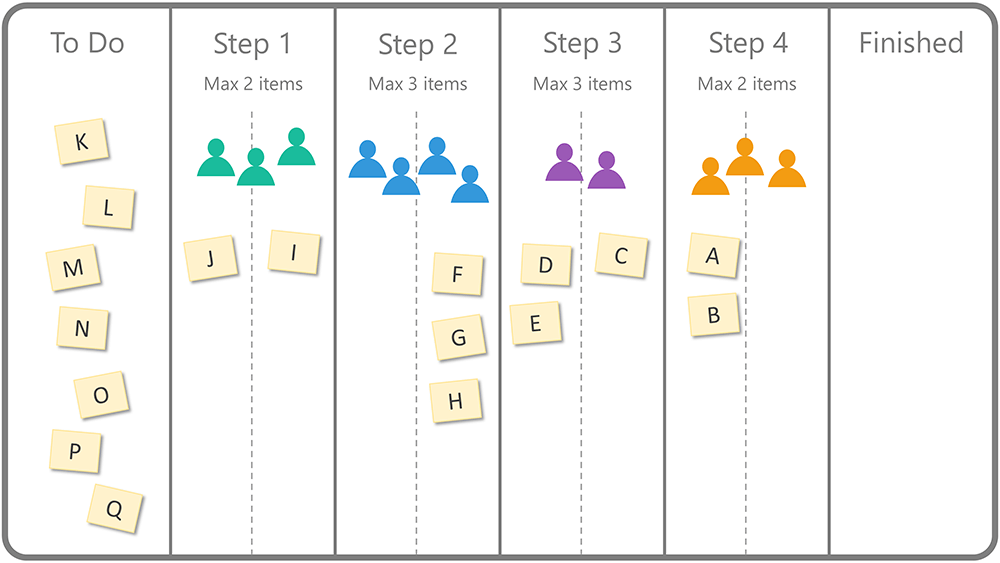
This can expand to other columns too: When Step 1 is done with (J) and Step 4 is done with (A) and (B), they also have to join Step 3 and try to solve the issue – everyone together.
So, that’s the idea behind the Kanban technique: Everyone’s focused on the whole process, rather than on just one step of it, and the highest priority is given to finishing items as soon as possible, instead of finishing as many tasks as possible and creating a lot of in-progress work.
Alright – so the Kanban board is the way we visualize this type of work. I usually emphasize it, because most people use Kanban boards, such as Trello, merely as simple, freestyle types of visualization for their tasks, independent of the Kanban technique. (I should confess, I sometimes do it as well!)
So, let’s review the concepts behind Gantt charts now, and then we can compare the two.
The concepts behind a Gantt Chart
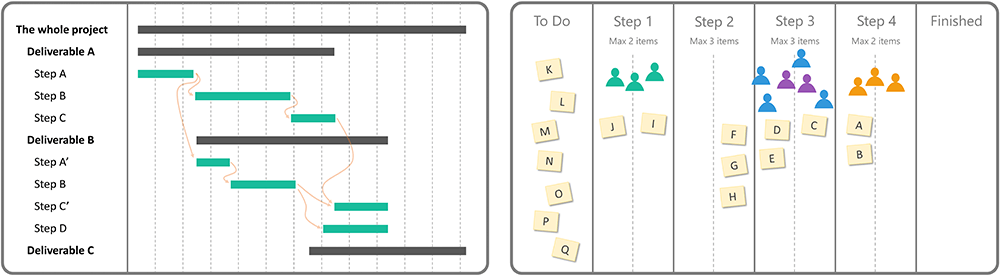
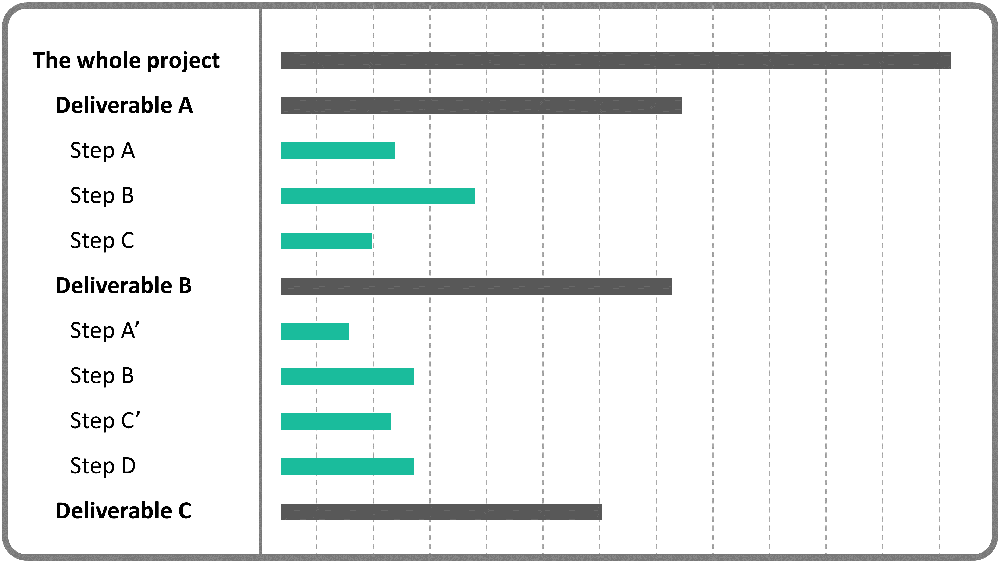
Here’s a typical Gantt chart:
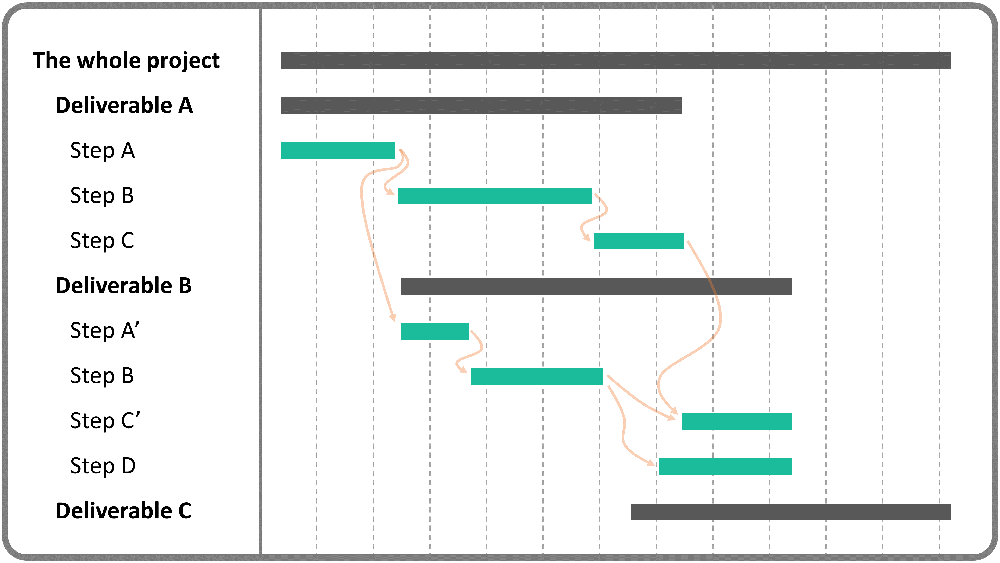
As you see, the start and finish date of activities are visualized here, and for example, there’s a finish date for the project as a whole, based on the underlying activities. Where do the dates come from, though?
A normal Gantt chart is entirely based on dependencies among activities. For example, Step A’ of Deliverable B cannot start before Step A of Deliverable A is finished.
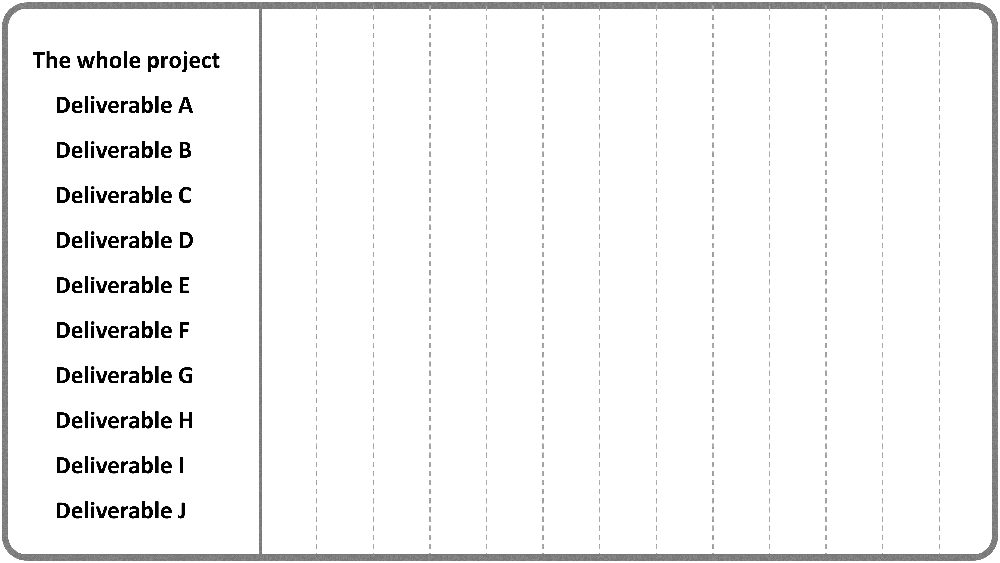
So, to make a Gantt chart, we first create the WBS, which stands for “work breakdown structure”, even though it’s not really about work, but is a hierarchy of deliverables. (At least, it’s supposed to be.)
Then, we check to see what steps of work (activities) are needed for each deliverable and add them to the list. These activities are somewhat similar to the columns on a Kanban board, except that we are not limited to a fixed set of activities and each deliverable can be different.
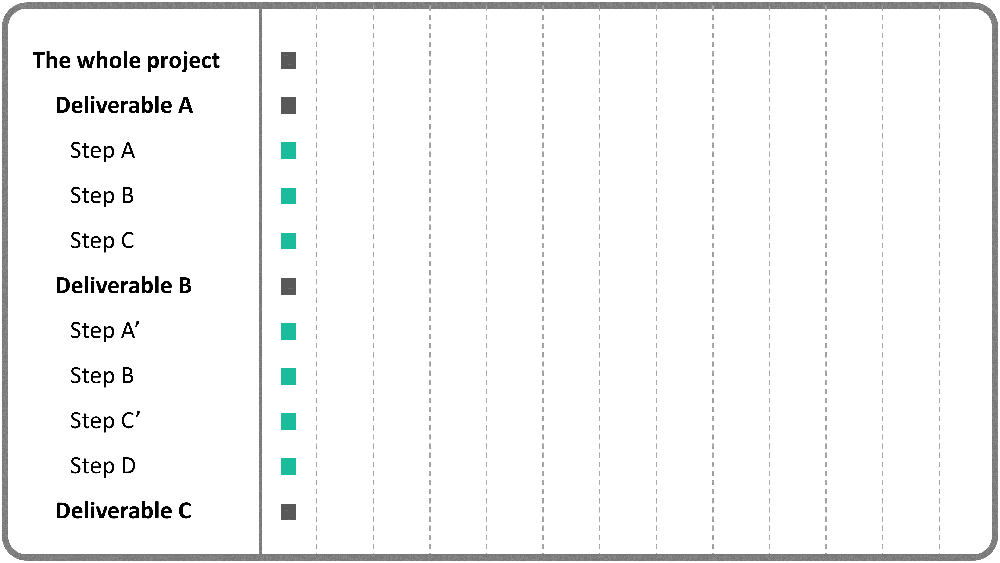
Then we estimate the duration of activities.
We then identify the dependencies among activities, which will determine the start and finish date of the activities, normally based on CPM (critical path method) calculations.
And voilà, we have a schedule!
Well, that’s the simplest form of a schedule, but there can be resources, constraints, different working hours for various activities and resources, etc.
So, the first outcome of using this CPM/Gantt combination is that we will have a bottom-up calculation that gives us the completion date of the project. But that’s not all … we can do a lot more. Here are some examples:
- We can check different scenarios. Suppose we’re worried that one of the suppliers may not deliver their product until 30 days later. How would it affect the project? It’s not easy to say in a non-linear setup, but when we have a proper schedule model, we can simply change the duration of that item and see how it affects everything else.
- We can analyze delays. Let’s say we’ve finished our project three months later than we were supposed to. However, some parts of the project were delayed because of the customer, and now we need to analyze the delays and see how much of the delay is our own responsibility. In this case, we can add the customer’s delays to the items in the schedule, see how much delay they create for the whole project, and then the difference between that and the actual delay will be our responsibility.
- We can find the most critical activities. Not every activity is the same. Some can be delayed for a reasonable time without delaying the whole project, while some are critical, meaning that each day of delay in those activities would add one day of delay to the whole project. Isn’t it a good idea to know which activities are critical and hence be more careful with them? CPM helps us find those activities.
Alright, so we’ve looked at the concepts and techniques behind Gantt charts and Kanban boards. Now we can really compare them!
Differences in context
Gantt charts are for projects, and not for manufacturing and other types of day-to-day business (aka business as usual or operations). I’ve seen many people consider their day-to-day business as projects and try to use tools and techniques such as Gantt chart and CPM, but that doesn’t work well. I’ve also seen people who claim that everything is a project (which is usually the trigger for me to start a very long discussion with them ;)
Kanban, on the other hand, was originally (and maybe primarily) meant for manufacturing, but people have also been using it in some projects for quite a while now.
Differences in the types of items
Columns are fixed on a Kanban board, which makes it useful when the items have very similar steps of work. This is not always the case, though, which limits the use of Kanban. We can always push ourselves to make the columns as generic as possible, to be applicable to every item, but that makes the Kanban system ineffective.
So, if the items in your project are very different from each other (e.g., in a construction project), a Kanban board may not be a good match.
Differences in dependencies
A Gantt chart is almost meaningless without dependencies. I still remember one of the releases of Microsoft Project, many years ago, when they first introduced the “manually scheduled items”, where you could create the chart without dependencies. It was considered blasphemy by many!
Regardless of this, you can consider CPM/Gantt as a tool for managing dependencies, but that’s not the case with a Kanban board, which is used when the items themselves do not have any interdependencies, and the only dependency is among steps of work that are visualized as the columns on the board.
When it comes to projects, the concept of dependencies is a little controversial. The generic explanation is that there are dependencies in predictive projects (some people call it “waterfall”, which I don’t like) and therefore a Gantt chart is a good option; whereas there are no dependencies in Agile projects, hence the suggestion for using Kanban boards.
I’ve even heard some people who are not big fans of Agile questioning Agile because “it doesn’t consider dependencies”. The point is that Agile does not ignore dependencies, but the idea is to approach the project and form the items in such a way that dependencies aren’t created. If done properly, there won’t be any – or at least, not many – dependencies.
Differences in planning methods
A Gantt chart works when there’s an upfront plan that covers the whole scope of the project, and works best when the plan is relatively detailed. This is because if there are only very high-level items in the plan, the dependencies among them will be very inaccurate and relatively arbitrary, as real dependencies are formed based on relatively small activities, and then reflected at the higher levels of plan.
So, if there’s no complete plan at the beginning of the project, a Gantt chart won’t work. On the other hand, a Kanban system doesn’t have any such constraints. You can always add new items to the first column and order the column again; then you keep going and add more items as they come up. To get a good understanding of it, imagine a team that supports a live software application by fixing bugs and adding minor features (which is day-to-day business rather than a project).
Because of this, a Gantt chart is not a suitable tool for typical Agile projects that don’t have upfront plans. In certain Agile projects (e.g., DSDM) there is a high-level upfront plan, though.
When to use Kanban boards
Because Agile projects can have items without dependencies, it’s possible to use Kanban boards in them. It can be both a visualization-only Kanban board, as is common in most Scrum projects, or a complete Kanban technique with its own board, which is common in the Kanban Development method.
On the other hand, a typical Agile project may not have a clear scope at the beginning, but lets it emerge and evolve throughout the project. This is very well supported by Kanban.
It’s not really possible to remove dependencies in predictive projects, nor to start the project without a defined scope. Although it’s always possible to start the project without a plan, it then wouldn’t be a predictive or adaptive project; it would just be chaos. So, for these two reasons alone, Kanban is simply not a good option for predictive projects.
When to use Gantt charts
A predictive project has a lot of dependencies and a scope that is defined upfront. A Gantt chart is designed specifically to support this type of project – simple as that!
Since Agile projects don’t have dependencies (or at least, are not supposed to have them), a Gantt chart won’t be helpful. Although some Agile projects (e.g., DSDM ones) do have a high-level upfront plan, which can be managed by a Gantt chart, most Agile projects, which use Scrum or different flavors of it, do not necessarily have any upfront plan, which makes it nearly impossible to use a Gantt chart.
Mixing the two!
How about mixing the two methods, then?
Each of the two is more useful for one of the Agile or predictive approaches; so, it won’t help if we try to mix the two at the project level. However, a possibly useful scenario is to have a Gantt chart for the project as a whole (a predictive project), and use Kanban boards for subsets of the project as and when it suits. For example, in a construction project, we may be able to use Kanban boards for subsets of work that have fewer dependencies and similar deliverables. Some types of design activity may be like that. Interestingly enough, some planning software tools support both representations for the same set of data, meaning that you can plan your project with them, and visualize it as both a Gantt chart and a Kanban board. They are very helpful for this type of mixture.
Related Courses
Our job is creating self-paced, online courses that are practical and pleasant! The following courses relate to the topic of this article, in case you’re interested:
By the way, the first lessons of each of these courses are free and you can take them even without registering.